TL;DR: Teztale is a new consensus-inspection tool for Tezos, developed by Nomadic Labs. This post shows you how to use it.
Consensus algorithms play a central role in maintaining the integrity and security of blockchain networks. They define the rules for how nodes reach agreement on the state of the network and how new valid blocks are added.
However, due to changing network conditions, it is not always a straightforward process. To monitor the behavior of Tezos’ consensus algorithm, Tenderbake, we have developed a monitoring tool called Teztale. Initially built for our Incident Response Team, we are now making Teztale available for anyone to use.
Tip: If you are not already familiar with Tenderbake, we suggest first taking a look at the following resources:
- Tezos’ consensus algorithm (documentation)
- A look ahead to Tenderbake (blog post)
- Tenderbake has been injected (blog post)
- Tenderbake’s Baker as a StateMachine (blog post)
- A Solution to Dynamic Repeated Consensus for Blockchains (research article)
Tenderbake Rounds
In Tenderbake, a block level (also known as “block height”) is made up of rounds, starting with round 0. Each round consists of three successive phases:
- A proposal phase where one of the bakers proposes a new block payload – the non-consensus content of the block (transfers, smart contract calls, voting operations, etc.).
- A pre-attestation voting phase, where validators vote to accept the proposed payload.
- An attestation voting phase, where validators vote upon the contents of the whole candidate block.
A quorum of votes (amounting to over 2/3 of the total active stake) must be gathered for the proposed block at the end of each voting step.
Ideally, whenever consensus is reached for a proposal at some level (i.e., attestation quorum is observed), each participant adds the proposed block to their local copy of the blockchain. Then a new instance of the algorithm is started for the next level.
However, things may go wrong for many reasons in practice. For instance, messages such as block proposals or (pre-)attestations could be lost or delayed, or some bakers could be desynchronized or offline. Consequently, in some situations, participants may only reach a consensus after multiple rounds.
Teztale enables you to keep track of this process as it unfolds.
Getting The Data
At the top right corner of the Teztale
page, you see the
head of the chain (
#3797158
in the example shown below) and the address of the Teztale server
providing data. If you use the data visualization page with your own
Teztale server, it can be / (the default value for data
visualization distribution), but any publicly accessible Teztale
server can be used. You can also use a Teztale server with a data
visualization page hosted somewhere else or running locally.
The Teztale UI gets data from a Teztale server connected to one or more Teztale archivers that filter and forward data from a Tezos node. The server gathers the data, deduplicates where needed, and stores it in the database.
The server also serves the raw JSON data for a level through its /<LEVEL>.json API endpoint. It contains basic information about blocks concerned by a level (timestamp, validation/application time, etc.), as well as information about each baker that should be involved in consensus at this level. The information includes all consensus operations published by the baker, when the consensus operations were received by the archiver node, and whether they were included in a block.
It is possible to connect multiple nodes/archivers running on the same Tezos network (Mainnet, testnets, local deployments) to a single server. Aggregating data from multiple archivers makes the collected information more reliable and representative, as it reduces biases stemming from individual archivers’ performance. Moreover, it makes the whole system more robust, ensuring that data is collected even if one (or a few) archiver nodes are down.
The data visualization page can use multiple sources in different ways, depending on what you are looking for: a single source, using minimal time across all the sources, using the average value, etc.
The Level Page
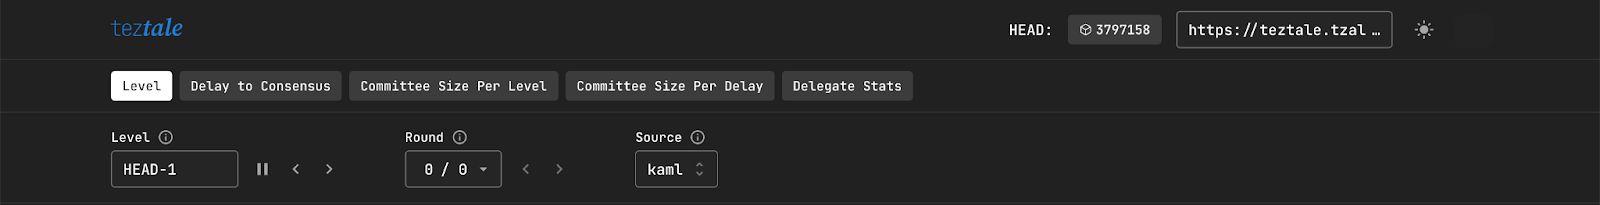
The navigation bar gives you quick access to different pages (Level, Delay to Consensus, etc.).
On the Level page, users can monitor events in real-time and investigate past behavior based on various parameters. It has a sub-menu with a few options:
-
Level is the block level. By default it’s locked on the alias Head-1, which means you are in ‘streaming mode’ and the page will automatically refresh when a new block is added to the chain. Pressing the pause button will halt the stream and let you see the relevant block number (#3797157 in our case). You can also enter any block level you would like to inspect. The arrow buttons let you browse through block levels.
-
Round allows you to select the round for a given level. When the network runs smoothly, there is usually no more than one round (round 0/0) in a block. For blocks where it has taken several rounds to reach consensus, you can switch back and forth between rounds as you would with level.
-
Source is the Teztale archiver used as a data source.
In order to see Teztale at work, we can use the extreme case of block level #3019851 as an example. This level took an exceptional 18 rounds for the network to reach consensus (see our investigation), causing approximately 52 minutes to elapse between block levels #3019850 and #3019852.
For blocks levels that were completed in a single round (normal conditions), the Level page shows three sections:
- a histogram;
- key block metrics and other info; and,
- a table classifying consensus operations according to different types (i.e., missed operations, valid operations, lost operations, etc.)
If you are inspecting a block level that has more than one round, as it is the case with #3019851, you will see an additional table classifying delegates according to arrivals and departures (more on that below).
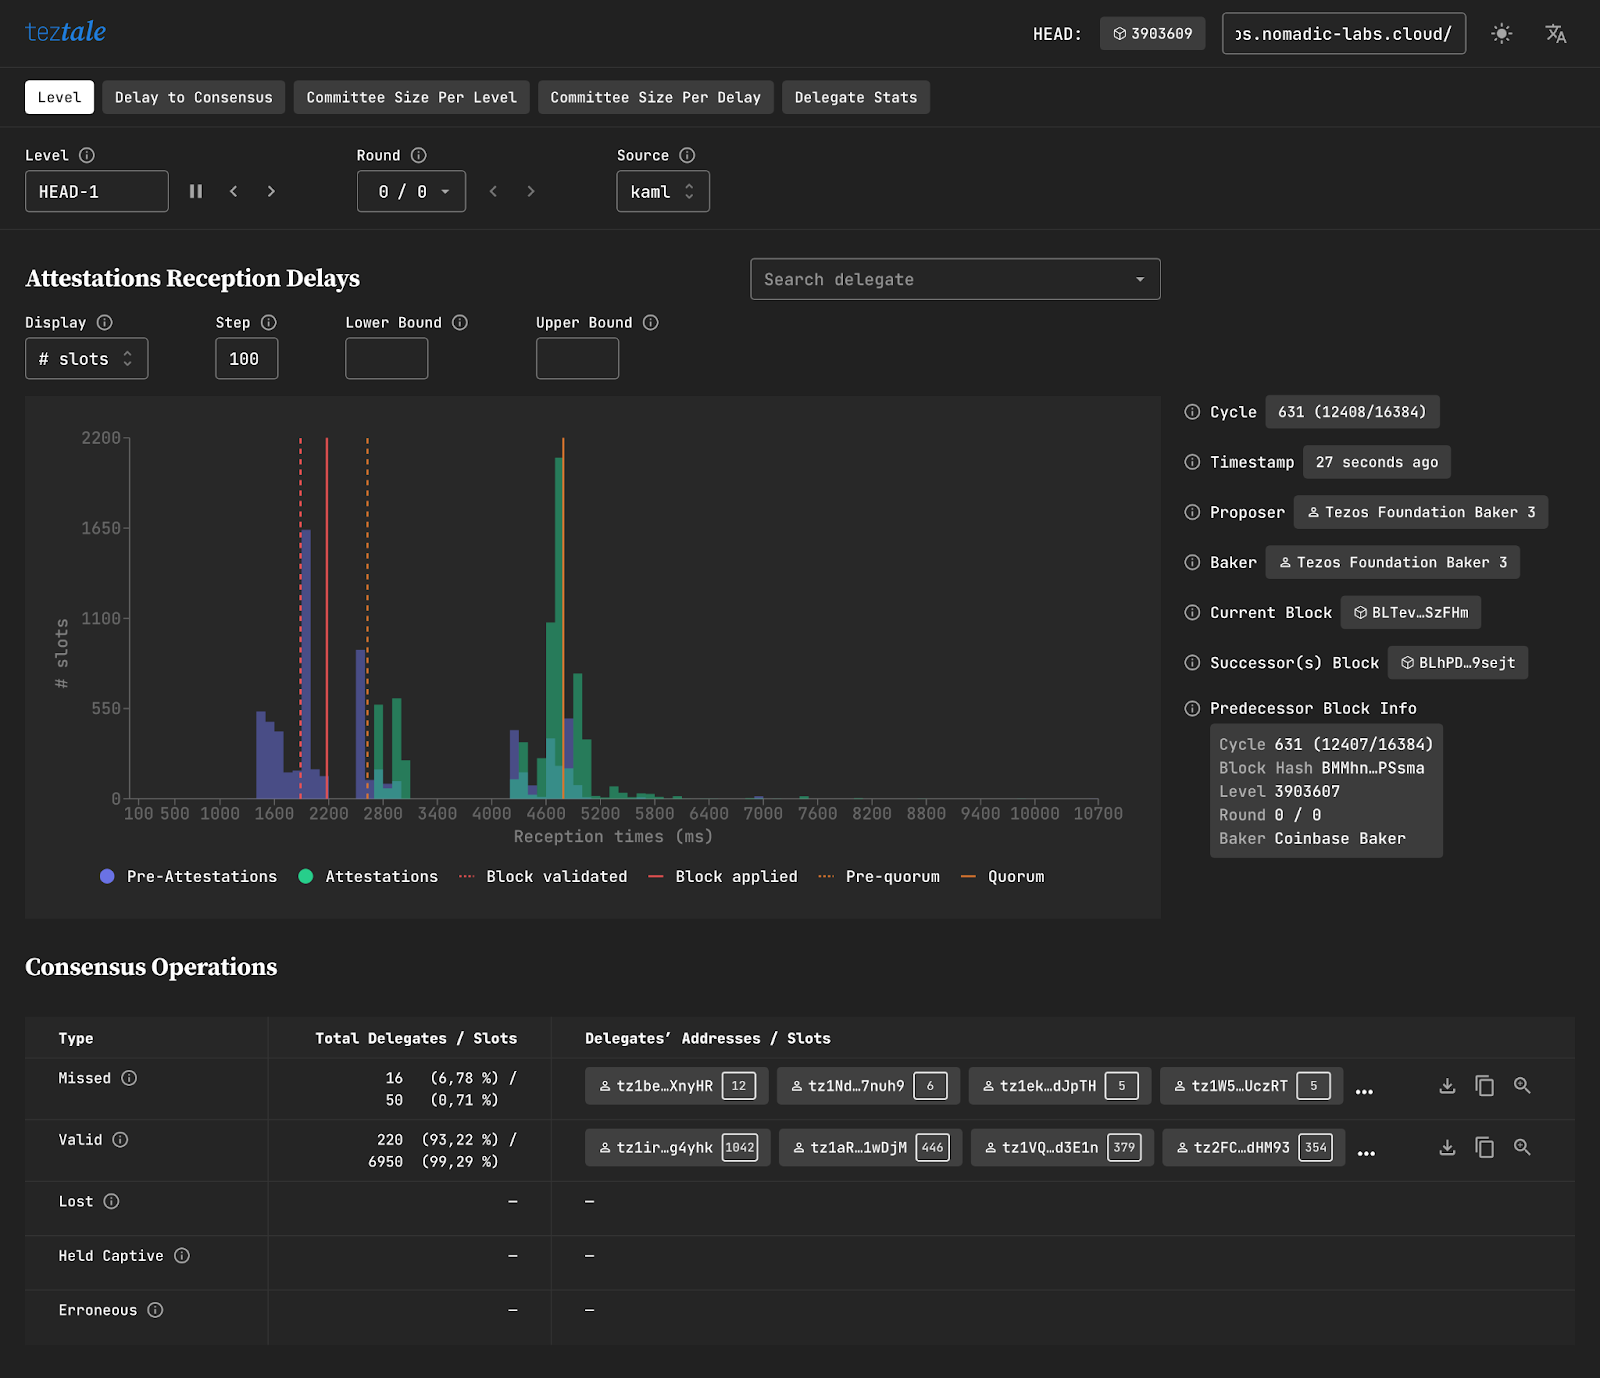
The Histogram
The histogram tracks the reception of the block proposal for each round, and its associated pre-attestations and attestations. The x-axis tracks the elapsed time since round rights were enabled, and the y-axis plots the delegates seen (pre-)attesting this proposal. At the top right, you can choose whether the y-axis should display the number of delegates or the number of slots.
The histogram also features additional indicators such as block validation, block application, pre-quorum, and quorum.
You can also see a delegate’s individual performance for (pre)attestation using the ‘Search delegate’ bar in the top right-hand corner. Paste a baker’s tz-address and search, or select a baker in the dropdown menu. The pre-attestation of the delegates you have selected will be shown on the histogram as violet and green dotted lines.
- Pro tip 1 : Click and drag to zoom in on an area of the chart.
- Pro tip 2 : Click a bar to see (pre–)attestations details. From there, you can either download a .csv file or copy the whole section.
Next to the histogram you’ll find information about the current block and round. For example, you can see if a round is a reproposal of a previous round. You can also find information about the preceding and succeeding block.
The Tables
The first table classifies the delegates’ consensus operations according to the following scenarios:
- Missed: These delegates were expected to participate in this round, but the node failed to receive their attestations, which were not included in the block.
- Valid: The node successfully received these delegates’ attestations, which were included in the block.
- Lost: The node successfully received these delegates’ attestations, but their attestations were not included in the block.
- Held Captive: Attestations from these delegates were included in the block, but the archiver node did not receive these operations.
- Erroneous: A Teztale archiver reported something wrong with these delegates’ attestations.
If the block level has more than one round, an additional table called ‘Delegates’ will be displayed. ‘Arriving’ delegates are validators that joined in during the current round, while ‘exiting’ delegates are validators that left during the current round.
Clicking a delegate’s address will present you with two options: copying the delegate’s address, or going to the Delegate Stats page, where you can take a closer look at any delegate’s performance.
The Delegates Stats page
The Delegate Stats page comes in handy when you need to pinpoint if and why a baker or the whole network is in trouble. Select the range of blocks you want to review, select a delegate, and then choose whether you want to display the delay or deviation (from the mean of all delegates).
The example below shows a baker missing a few attestations in a row.
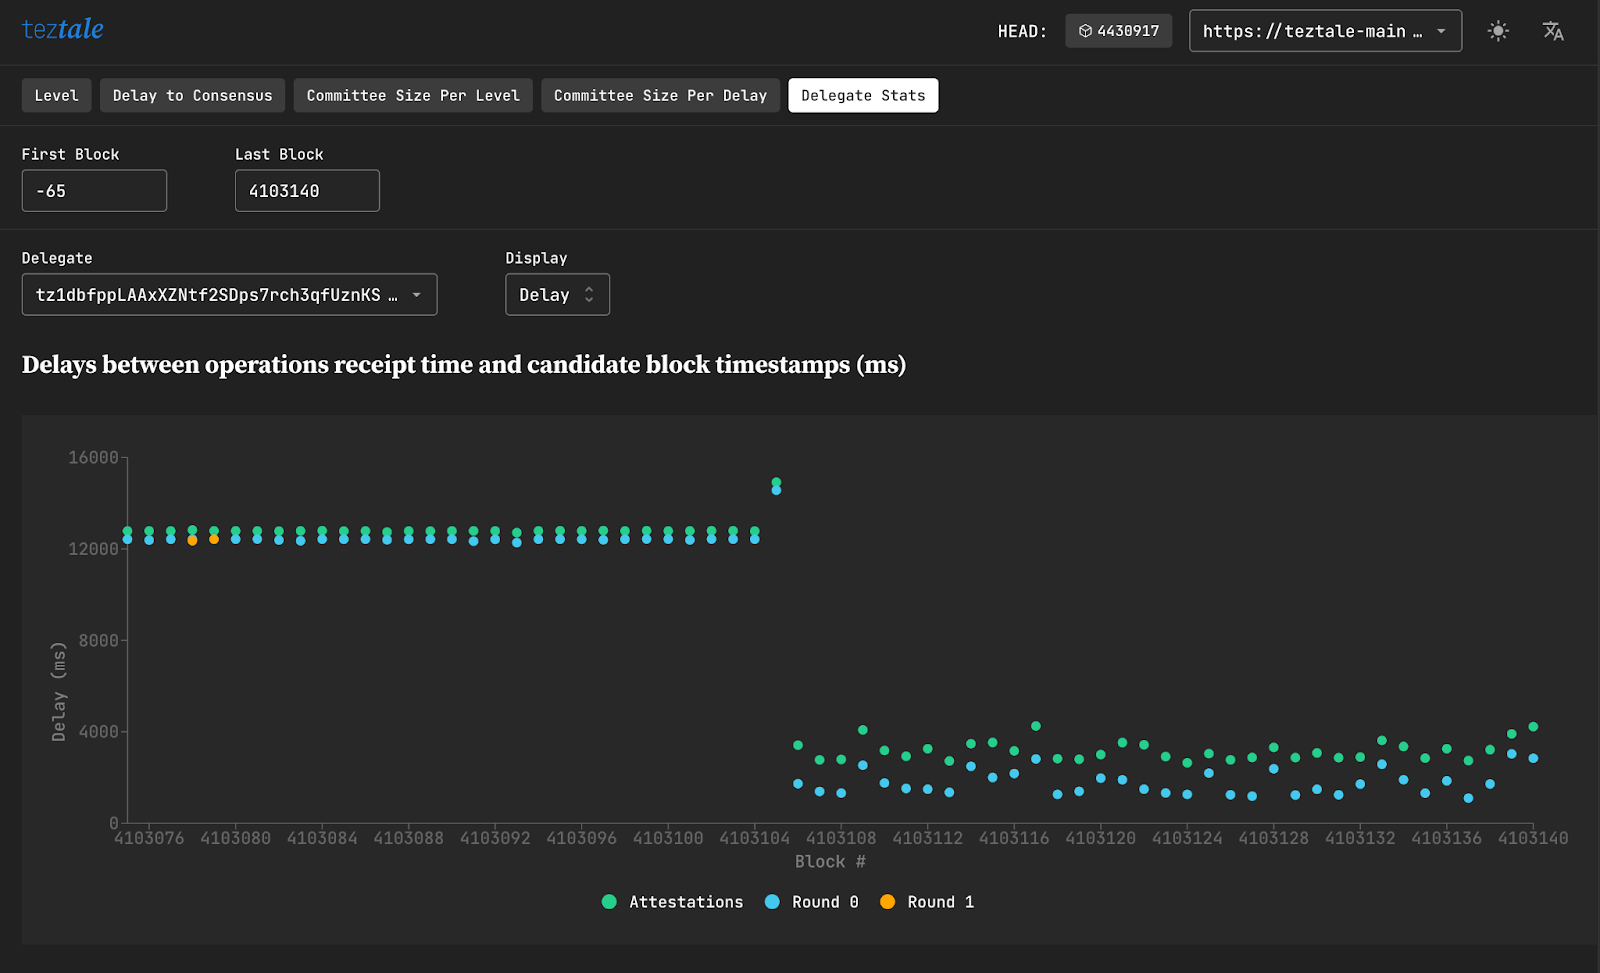
At the left of the scatter plot, we can see that the baker’s attestations were all received around 12 seconds after the candidate block. This is late considering that since the activation of the Mumbai protocol on Tezos Mainnet, the minimal (and desired) block time is 15 seconds.
There are a number of possible causes for something like this to happen, but the baker was able to identify and fix the problem quickly (starting from block #4103106), as they knew there had been a problem with their clock not being on time.
Happy monitoring!
Teztale was designed for our Incident Response Team as a tool to monitor the overall health of Tezos network, but as we have shown in this guide, Teztale’s utility is much broader.
Whether you are looking to get a better understanding of Tezos’ consensus algorithm at work, or need to inspect and analyze a specific baker’s performance, Teztale has you covered.