Introduction
Until now, the only tool developers had to monitor the behavior of their Tezos node was to look at the logs, adjust the log verbosity, and reconstruct all relevant information from this stream. But getting more insight into a node’s performance was tedious and difficult. For instance, the number of connected peers, the number of pending operations, or the number of times the validator switched branches, were not easy to observe continuously.
After a few iterations of different methods to gather node information and statistics that could be easily analyzed, we have recently chosen to include metrics within the node. With Octez Metrics it’s simple to get a myriad of statistics about your node — and quite efficiently so. You can also attach a Grafana dashboard to get a visual representation of how your node is performing. And with Grafazos, you can get customized ready-to-use dashboards for monitoring your Tezos node.
A Grafazos dashboard looks like this:
As you can immediately see at the top, the dashboard will tell you your node’s bootstrap status and whether it’s synchronized, followed by tables and graphs of other data points.
Node metrics
In previous versions of Octez, a separate tool was needed for this task. tezos-metrics exported the metrics which were computed from the result of RPC calls to a running node. However, since the node API changed with each version, it required tezos-metrics to update alongside it, resulting in as many versions of tezos-metrics as Octez itself. Starting with Octez v14, metrics were integrated into the node and can be exported directly, making it simple to set up.
Moreover, as the metrics are now generated by the node itself, no additional RPC calls are needed anymore. This is why the monitoring is now considerably more efficient!
Setting up Octez Metrics
To use Octez Metrics, you just start your node with the metrics server enabled. The node integrates a server that registers the implemented metrics and outputs them for each /metrics HTTP request.
When you start your node you add the --metrics-addr option which takes as a parameter <ADDR:PORT> or <ADDR> or :<PORT>. This option can be used either when starting your node, or in the configuration file (see https://tezos.gitlab.io/user/node-configuration.html).
Your node is now ready to have metrics scraped with requests to the metrics server. For instance, if the node server is configured to expose metrics on port 9932 (the default), then you can scrape the metrics with the request http://localhost:9932/metrics.
The result of the request is the list the node metrics described as:
#HELP metric description
#TYPE metric type
octez_metric_name{label_name=label_value} x.x
Note the metrics are implemented to have the lowest possible impact on the node performance, and most of the metrics are only computed when scraping it. So starting the node with the metrics server shouldn’t be a cause for concern. More details on Octez Metrics can be found in the Tezos Developer Documentation: see here for further detail on how to setup your monitoring; and here, for the complete list of the metrics scrapped by the Octez node.
Types of metrics
The available metrics give a full overview of your node, including its characteristics, status, and health. In addition, they can give insight into whether an issue is local to your node, or it is affecting the network at large — or both.
The metric octez_version delivers the node’s main properties through label-value pairs. It provides the node version or the network it is connected to.
Other primary metrics you likely want to see are the chain validator1 ones, which describe the status of your node: octez_validator_chain_is_bootstrapped and octez_validator_chain_synchronisation_status. A healthy node should always have these values set to 1. You can also see information about the head and requests from the chain validator.
There are two other validators, the block validator2 and the peer validator3, which give you insight on how your node is handling the progression of the chain. You can learn more about the validators here.
To keep track of pending operations, you can check the octez_mempool metric.
You can get a view of your node’s connections with the p2p layer metrics (prefixed with octez_p2p). These metrics allows you to keep track of the connections, peers and points of your node.
The store can also be monitored with metrics on the save-point, checkpoint and caboose level, including the number of invalid blocks stored, the last written block size, and the last store merge time.
Finally, if you use the RPC server of your node, it is likely decisive in the operation of your node.
For each RPC called, two metrics are associated: octez_rpc_calls_sum{endpoint="...";method="..."} and octez_rpc_calls_count{endpoint="...";method="..."} (with appropriate label values). call_sum is the sum of the execution times, and call_count is the number of executions.
Note that the metrics described here are those available with Octez v14—it is likely to evolve with future Octez versions.
Dashboards
While scraping metrics with server requests does give access to node metrics, it is, unfortunately, not enough for useful node monitoring. Since it only gives a single slice into the node’s health, you don’t really see what’s happening over time. Therefore, a more useful way of monitoring your node is to create a time series of metrics.
Indeed, if you liked the poster, why not see the whole movie?
The Prometheus tool is designed for this purpose, to collect metric data over time.
In addition, in order to get the most out of your metrics, it should be associated with a visual dashboard. A Grafana dashboard, generated by Grafazos gives a greater view into your node. Once your node is launched, you can provide extracted time series of metrics to Grafana dashboards.
The Grafazos version for Octez v14 provides the following four ready-to-use dashboards:
octez-compact: A compact dashboard that gives a brief overview of the various node metrics on a single page.octez-basic: A basic dashboard with all the node metrics.octez-with-logs: Same as basic but also displays the node’s logs, with Promtail Promtail (for exporting the logs).octez-full: A full dashboard with the logs and hardware data. This dashboard should be used with Netdata (for supporting hardware data) in addition to Promtail.
Note that the last two dashboards require the use of additional (though standard) tools for hardware metrics and logs (Netdata, Loki, and Promatail).
Let’s look at the basic dashboard in more detail. The dashboard is divided into several panels. The first one is the node panel, which can be considered the main part of the dashboard. This panel lays out the core information on the node such as its status, characteristics, and statistics on the node’s evolution (head level, validation time, operations, invalid blocks, etc.).
The others panels are specific to different parts of the node:
- the p2p layer;
- the workers;
- the RPC server;
along with a miscellaneous section.
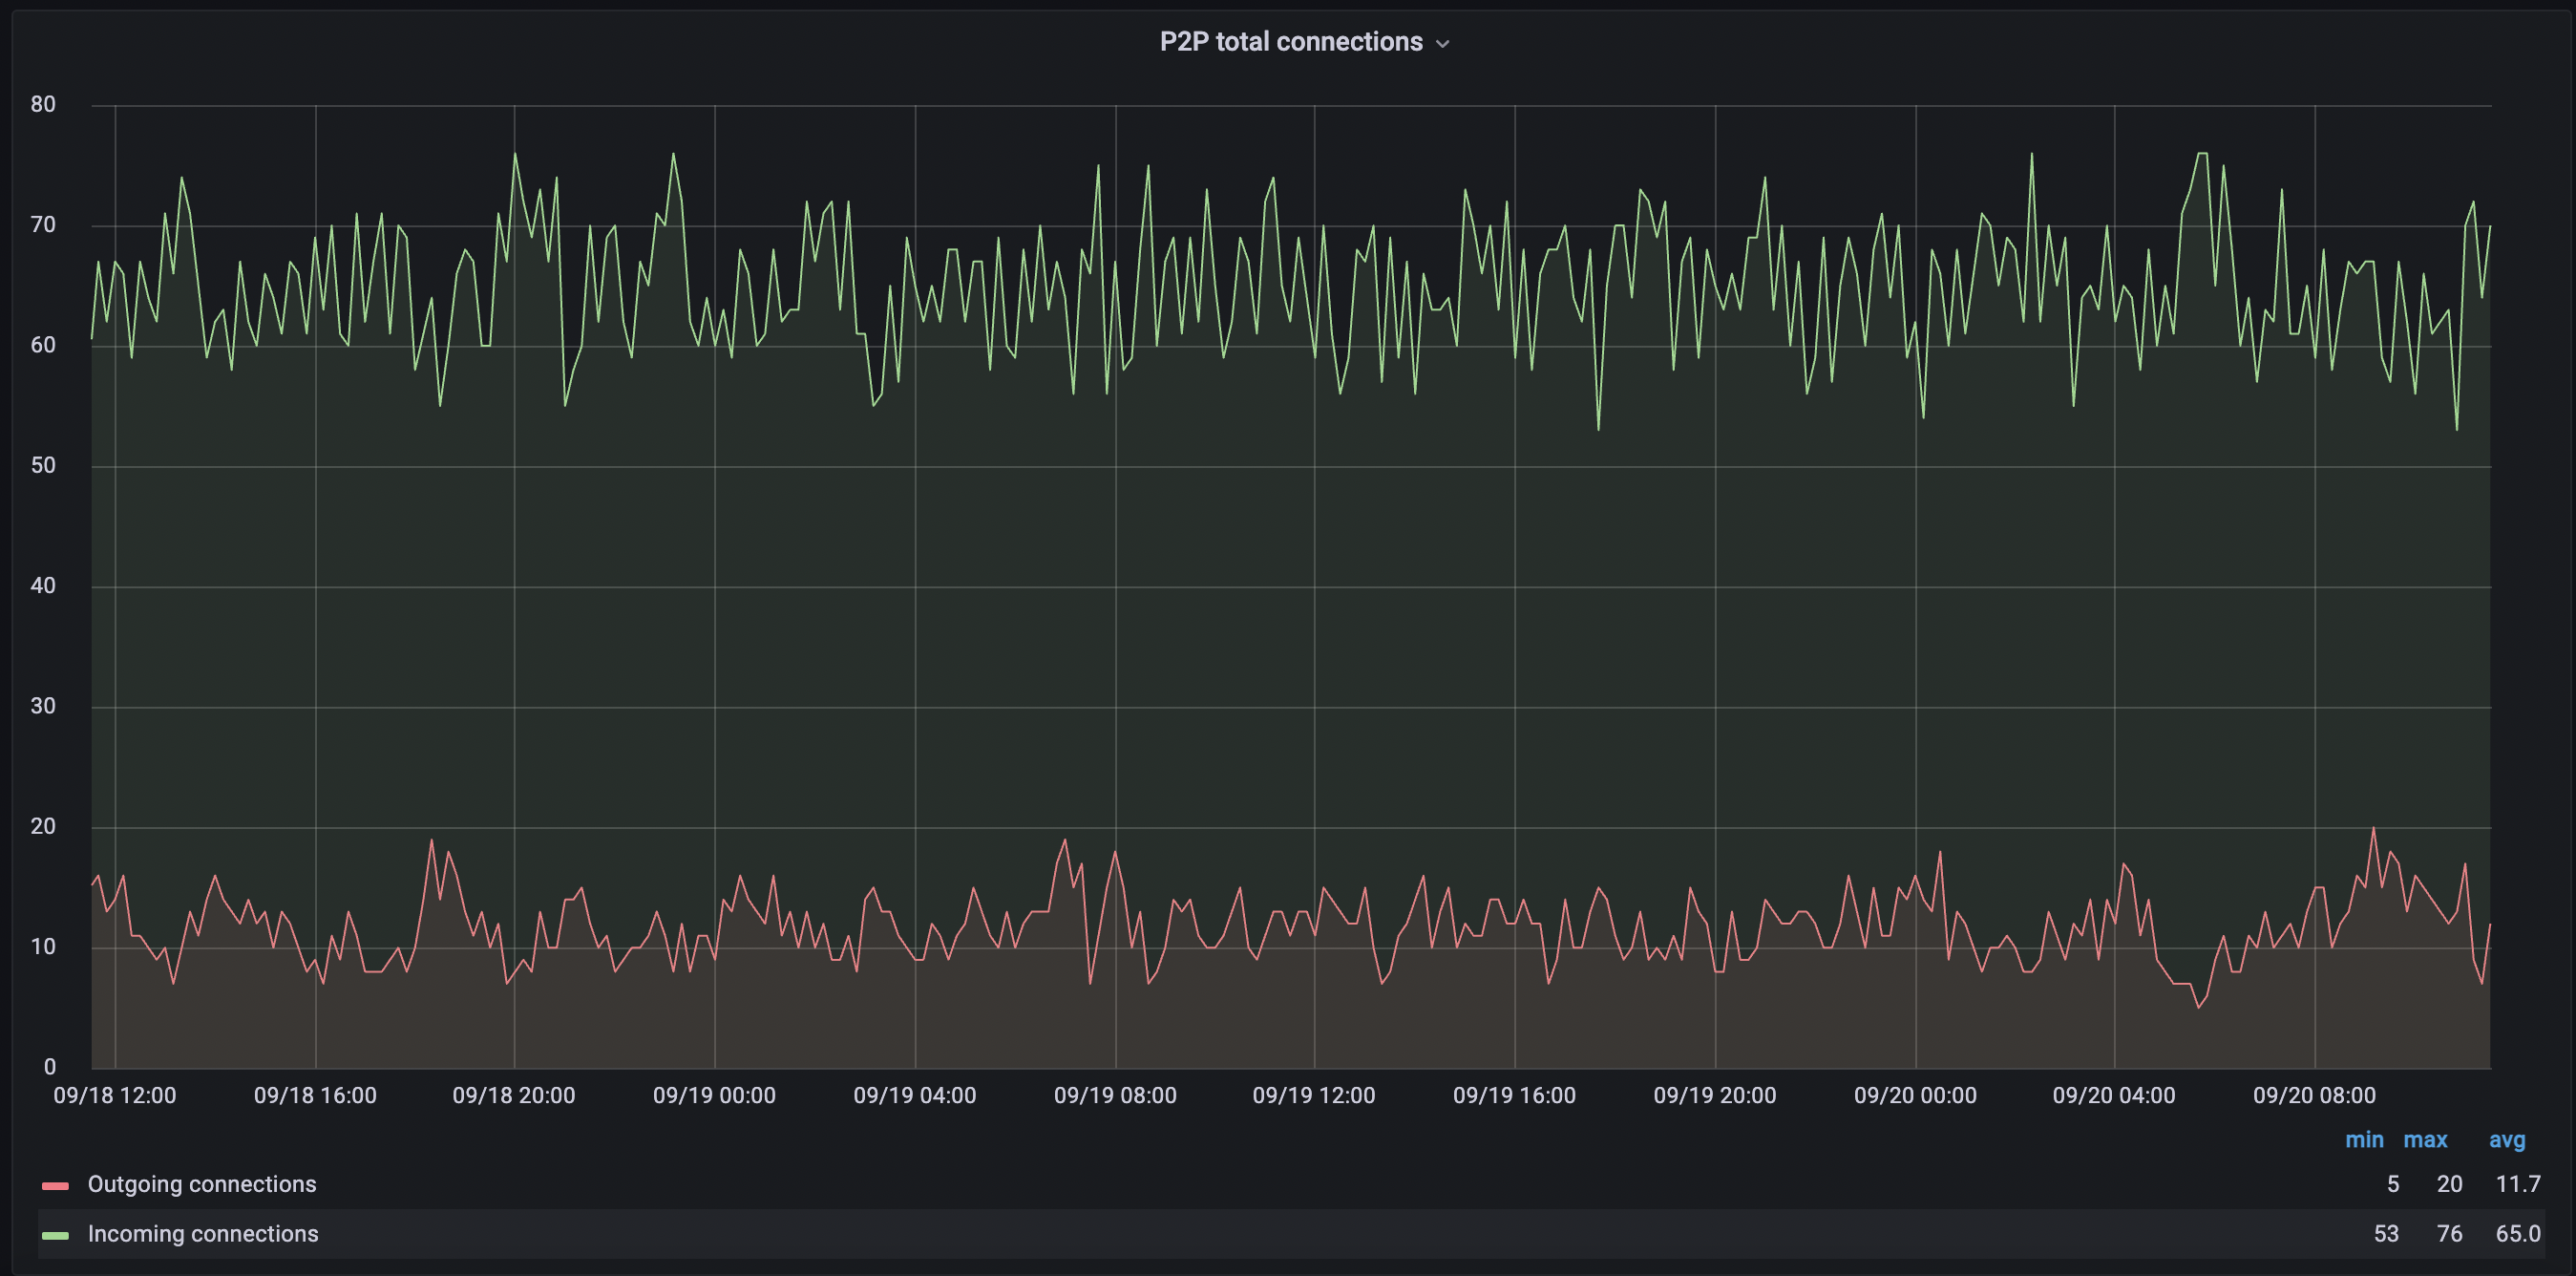
Some metrics are self-explanatory, such as P2P total connections, which shows both the connections your node initiated and the number of connections initiated by peers. Another metric you may want to keep an eye on is Invalid blocks history, which should always be 0 — any other value would indicate something unusual or malicious is going on.
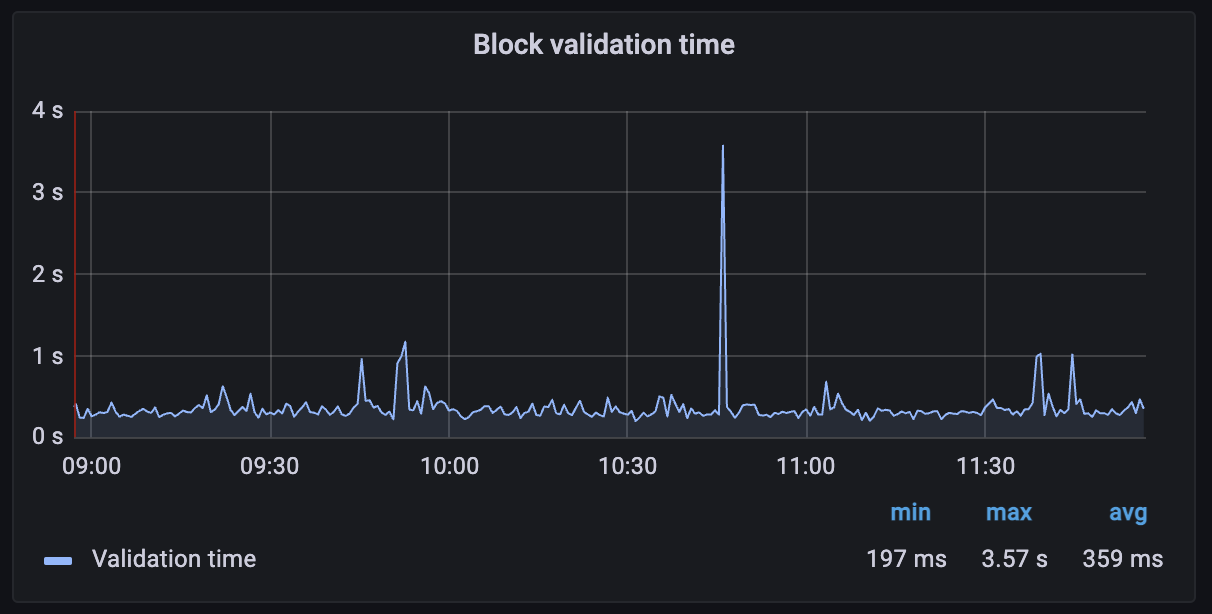
Another useful metric is the Block validation time, which measures the time between when a request is registered in the worker till the worker pops the request and marks it complete. This should generally be under 1 second. If it’s persistently longer, that could indicate trouble too.
The P2P connections graph will show you immediately if your node is having trouble connecting to peers, or if there’s a drop-off in the number of connections. A healthy node should typically have a few dozen peer connections (depending on how it was configured).
The Peer validator graph shows a number of different metrics including unavailable protocols. An up-to-date, healthy node should see this as a low number. If not it can indicate that your node is running an old version of Octez, or that your node is being fed bad data from peers.
Note again these dashboards are built for Octez v14 and are likely to evolve with the Octez versions.
Working with Grafazos
Grafazos allows you to set different options when generating the ready-to-use dashboards described above. For instance, you can specify the node instance label, which is useful for a dashboard that aims to monitor several nodes.
Furthermore, you can manually explore the metrics from the Prometheus data source with Grafana and design your own dashboards. Or you can also use Grafazos to import ready-to-use dashboards for your node monitoring. You can find the packages stored here. There is a package for each version of Octez.
Grafana is a relatively user-friendly tool, so play with creating a custom dashboard as you like. You may also want to use the “explore” section of Grafana. Grafazos is also particularly useful in automatic deployment of Tezos nodes via provisioning tools such as Puppet or Ansible.
Conclusion
We developed Octez Metrics to give Tezos users a better insight into how their node is performing, and to observe the overall network health. This is a product that will continuously improve, and we encourage node operators and bakers to suggest new features and additional metrics that they would like to see. We recognize that the best way to keep your node healthy — and in turn, to keep the entire Tezos network healthy — is to provide everyone the tools needed to monitor their setup.
-
The chain validator is responsible for handling valid blocks and selecting the best head for its chain. ↩
-
The block validator validates blocks and notifies the corresponding chain validator. ↩
-
Each peer validator treats new head proposals from its associated peer, retrieving all the operations, and if valid, triggers a validation of the new head. ↩